2019 ||| Skills: Python, Matplotlib, tkInter, Data Analysis ||| live: GraphPie ||| Repo: Source
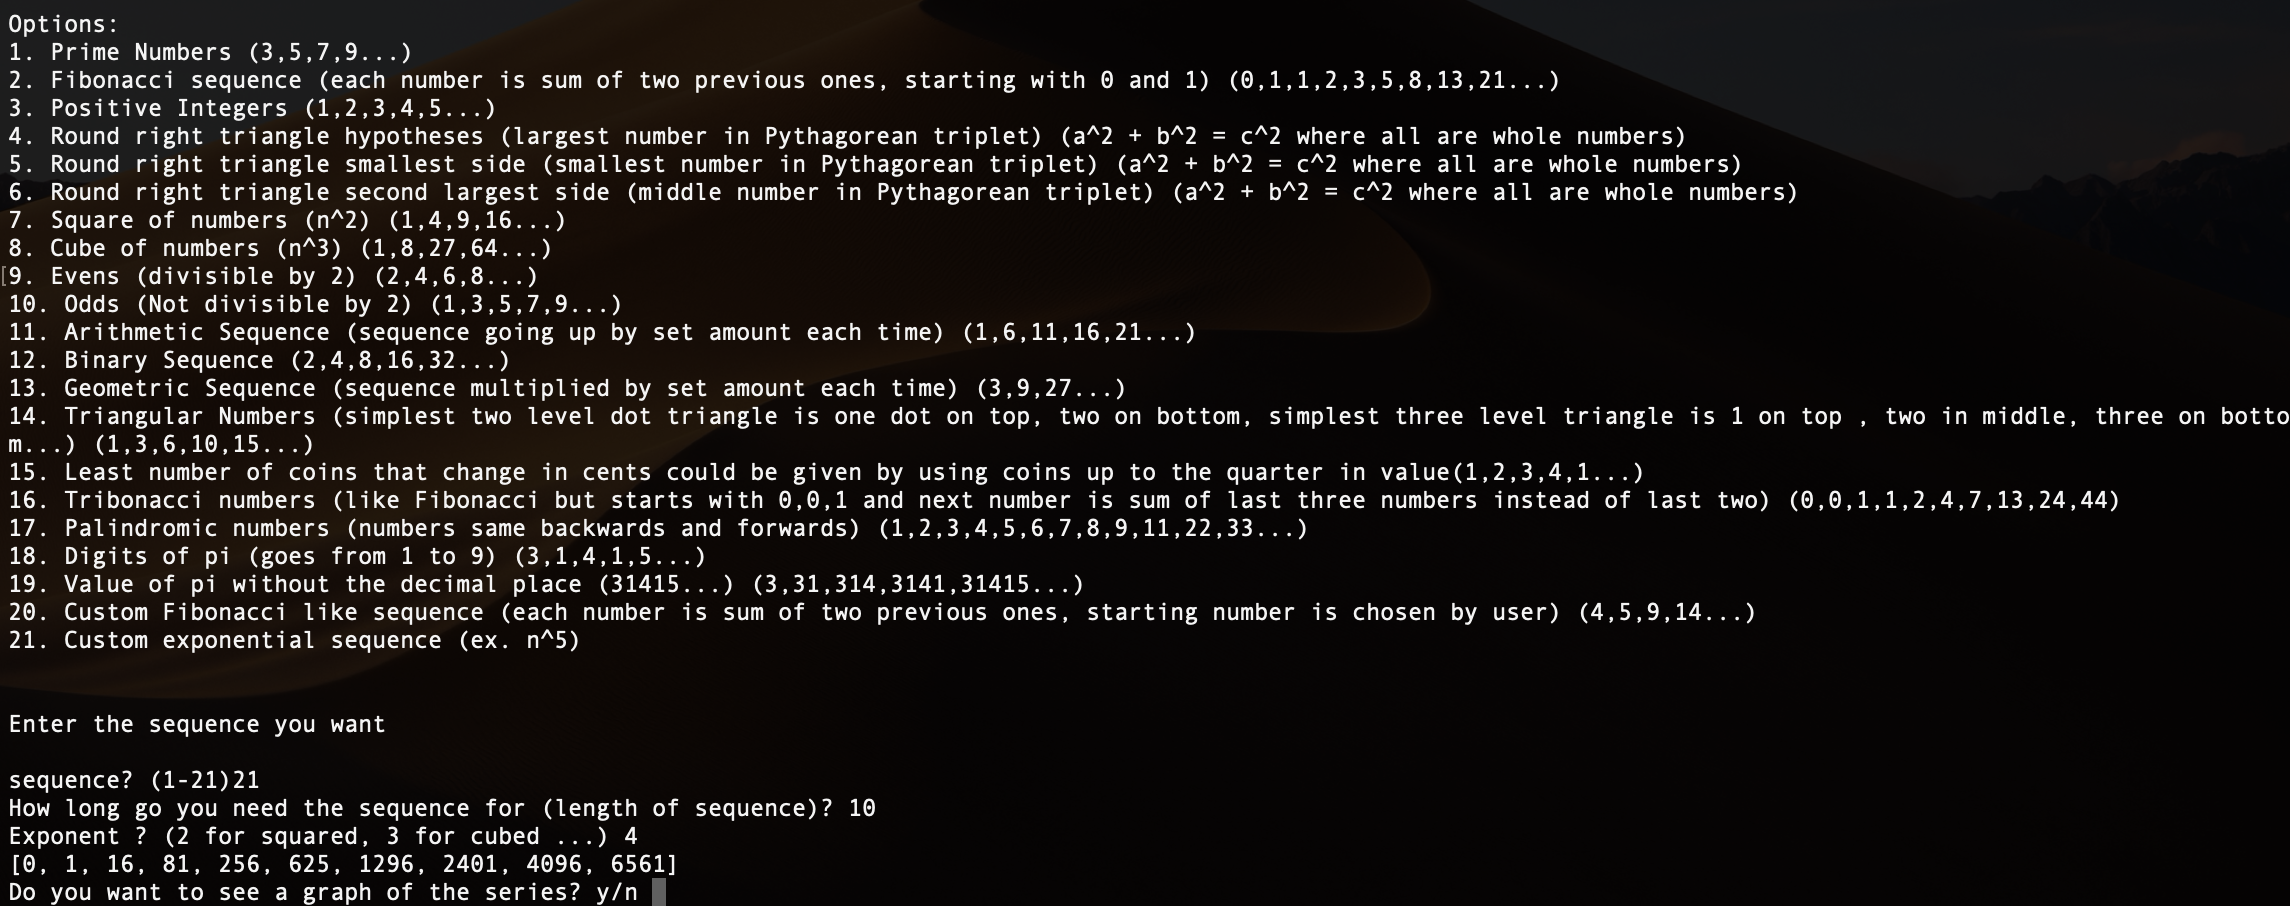
Python graphing of mathematical functions, with both a GUI and CLI to a single Python OO backend
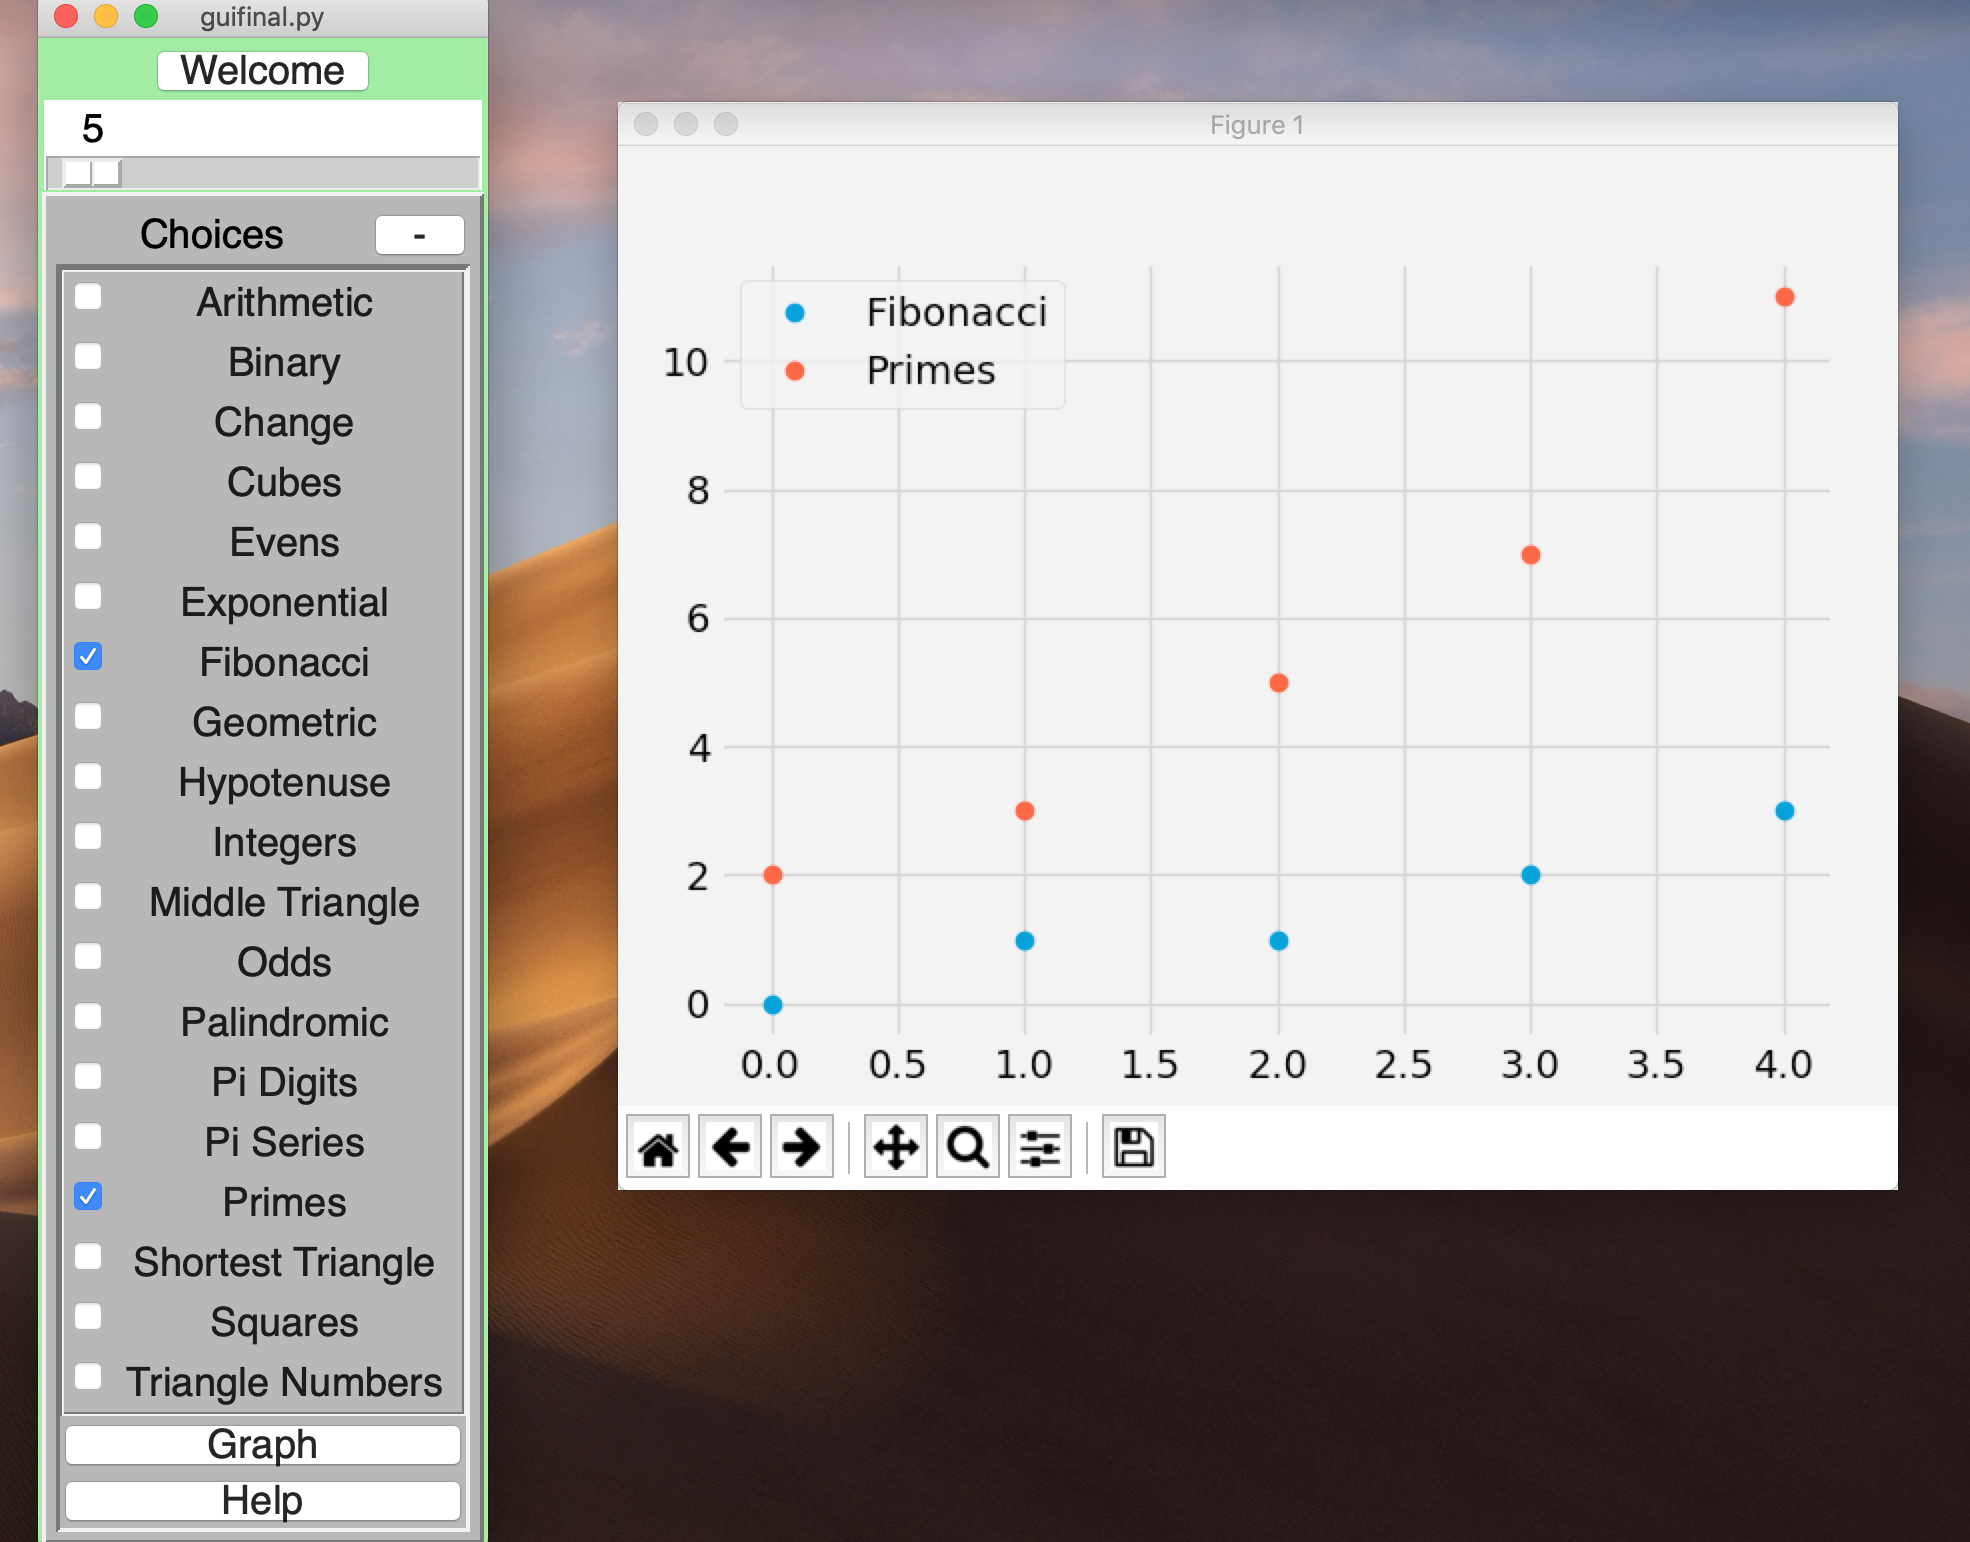
Uses matplotlib for a zoomable and customizable graph of more than 20 mathematical functions.
Allows multiple functions to be graphed on the same window for easy comparison.
Cross platform compatible GUI application that works on all three major operating operating systems.
Separation of concerns and OOP allow both interfaces to use the same backend.